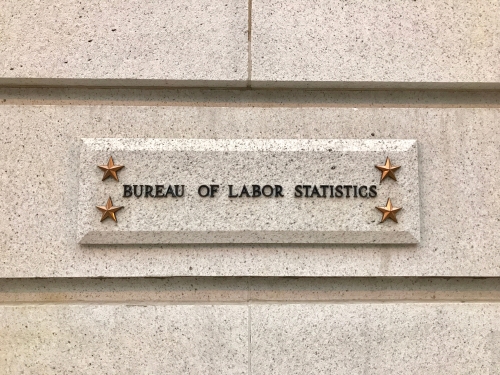
Earlier this week I did a post on the 2019 union membership statistics from the Bureau of Labor Statistics (BLS). According to the BLS, in 2019, 35.37% of all state and local employees were members of a union, while 38.68% of all state and local employees were represented by a union. If you do the math, that means the union membership rate is 91.4%. That seems really high to me. I would have guessed the average union membership rate at between 60%-80%.
One issue may be how the BLS determines if someone is a union member. According to the BLS, union membership is determined in the following manner:
Employed wage and salary workers are classified as union members if they answer “yes” to the following question: On this job, are you a member of a labor union or of an employee association similar to a union? If the response is “no” to that question, then the interviewer asks a second question: On this job, are you covered by a union or employee association contract? If the response is “yes,” then these persons, along with those who responded “yes” to being union members, are classified as represented by a union. If the response is “no” to both the first and second questions, then they are classified as nonunion.
This is speculation, but what could be happening is that employees are answering “yes” to question number one even though they are not “members” because they don’t know the difference or they are confused. Because they answer “yes” to question number one, they never get asked question number two. Had they been asked question two, it might prompt them to clarify their answer to question number one, but without question two there is no such clarification. If this is happening, it would artificially inflate the union membership percentage. However, the year-to-year changes should still be fairly accurate since the BLS presumably has been using the same questions for many years.
This entry was posted in News.
Previous post: New Labor Statistics Suggest Negligible Janus Effect
